Google Analytics 4, Hotjar, Maze, Google Tag Manager, Calendly, WordPress
People were arriving, but not understanding enough to act.
CADworks3D makes high resolution 3D printers and resins for microfluidics, the tiny channel devices research labs use for cell biology, diagnostics and chemistry. Every sale goes through a quote or a conversation with our sales team.
The business goal. More enquiries for our sales team, from a website that looks as credible as the science behind the products.
The UX goal. Find out why visitors weren’t getting there, then design a site that helps them understand what we make, choose the right product, trust the evidence, and reach a person or a quote easily.
My role was the UX goal. Enquiries were how the business would judge it.
cadworks3d.com
The redesigned homepage. Scroll inside the window to see the full page.
02
What the team believed, and what the data said
Two of the three beliefs were reframed by the data.
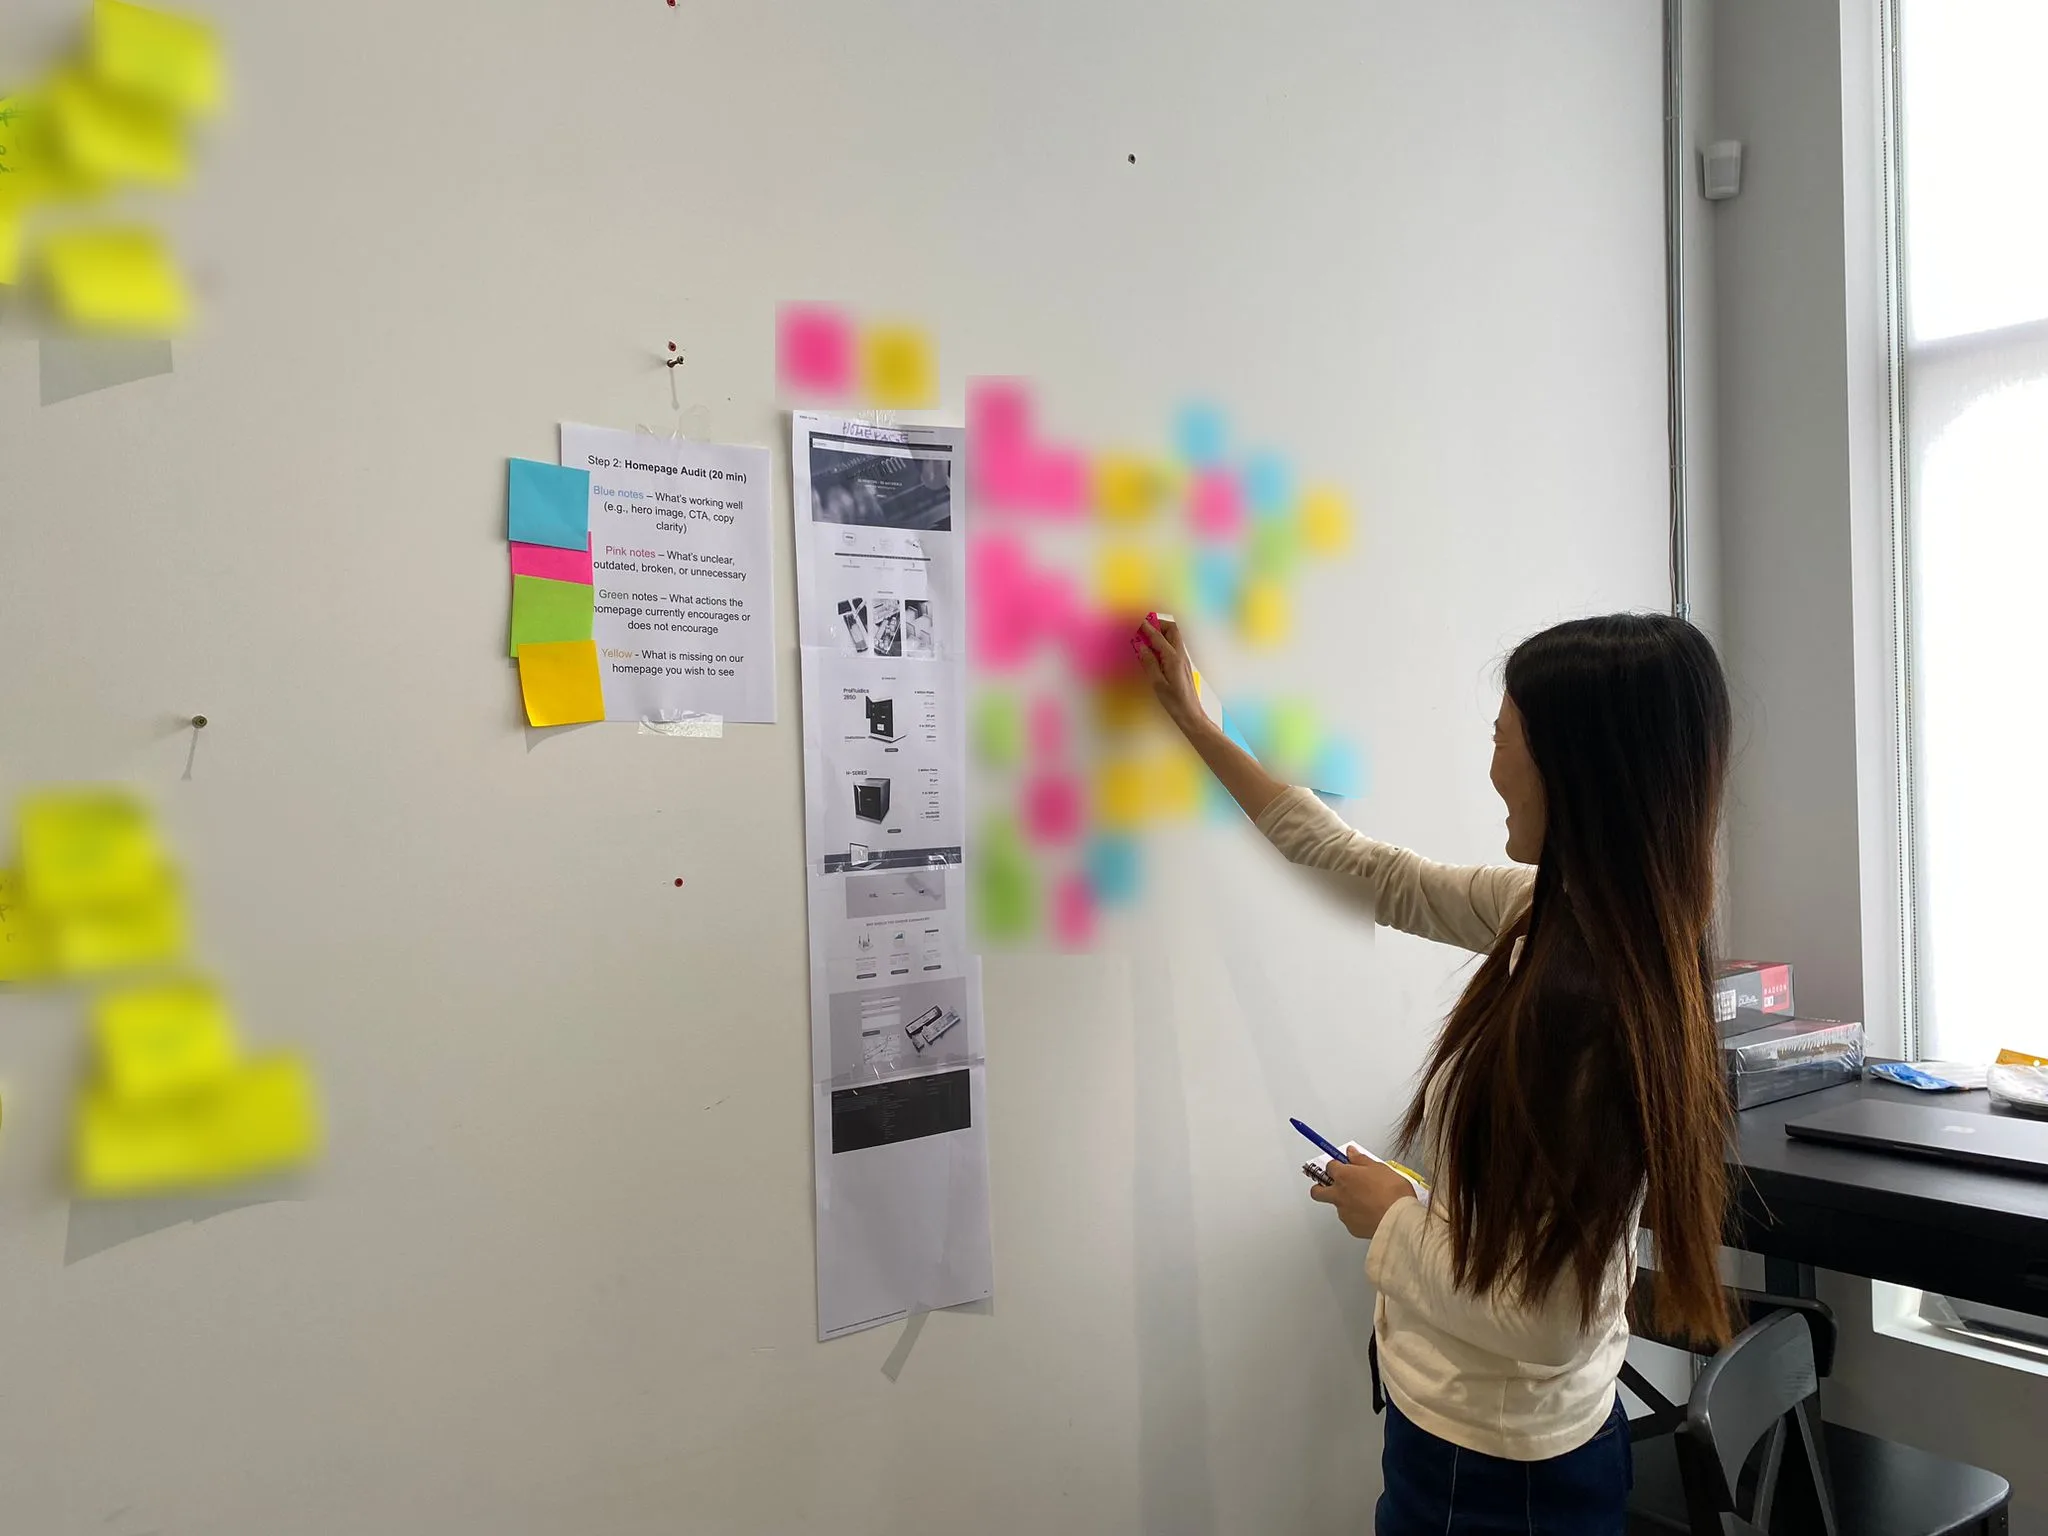
Before the research, we reviewed the analytics, the heatmaps we had set up to study together, and the homepage content as a team. That gave us three working beliefs, each written as a problem statement, and I tested each one against the data.
“Visitors aren’t motivated to act.”
Few visitors clicked a button or filled in a form, but the people who did get in touch were clearly serious Low action didn’t mean low interest.
Reframed
“Visitors need simpler information.”
Visitors did misunderstand what we sell, yet the most technical section drew the most attention. They needed to know what the system is first, with the detail underneath.
Reframed
“Unclear hierarchy hides content.”
True for the homepage. The content itself was good, but where it sat decided whether people read it.
Confirmed
The webpage review as a team, where our beliefs stemmed from.
03
How I researched it
Seven independent sources, both numbers and words.
Mixed methods triangulation. Nothing was collected specially for the study. I reanalysed data the business already held, both numbers and words, and compared it across seven independent sources.
What people did
Web analytics and heatmaps.
What people said
Four years of quote form responses, two observed sales calls, and an interview with our sales team.
Who they were
Roles from call bookings and from a self serve interest form.
04
What I found
What researchers needed already existed. It sat where people didn’t reach.
1
Trying it first mattered most, and was buried.
The free sample was the most effective page on the site, yet about 2% of traffic ever reached it.
“That’s great to have a sample box to test it.”
A principal investigator
2
People couldn’t tell which product fit them.
Very few visitors landing on the printer overview went on to a printer page, and the comparison table made the cheaper printer look sharper than the 285D.
“What is a DLP printer?”
A principal investigator writing a grant
3
Proof drove discovery, but sat behind a carousel.
Visitors arriving from conferences and published research engaged most, yet institutional proof reached about 1 homepage visitor in 10.
4
The first screen lost half of visitors
before explaining what the product was.
5
Placement, not content, decided what got read.
The same two resin products were read to the end twice as often on one template as on another.
6
Researchers wanted to know if it could make their part.
Resolution and feature size was the most common question people asked, usually with their own dimensions attached, and the one section showing real features with measurements was the only part of the site drawing both attention and clicks.
05
Who we designed for, and how they decide
The Funded Newcomer
Budget holder, new to 3D printing, naming an instrument in a grant. Needs the category explained first.
The Bench Evaluator
Student or postdoc doing the technical assessment, often finding us through published papers. Needs evidence and something to try.
The Frustrated Switcher
Budget holder who has outgrown their current printer. Needs proof their specific problem is solved.
The Method Switcher
Expert in a different fabrication method, deciding whether to change method altogether.
The buyer is usually two people.One evaluates the technology and the other holds the budget, and they tend to reach us through different doors.
How they decide
Pain point on the old site
01
Does this suit our team’s research?
First screen didn’t explain the approach
02
Will it hold up in practice?
In any order
Can it make my part?
Dimensions locked in an image
How much work is it?
Workflow hidden in a carousel
Can I trust it?
Customer university logos buried in a slider
03
Which one fits?
Only specs, no real comparison
04
Get it approved.
Talk to a specialist or request a quote, at any step
In a first impression test with life science professionals recruited outside our customer base, the details people remembered most matched what our enquiries asked about, the workflow, the channel sizes and the labs that use it.
06
What we changed
Rebuilding the platform
I rebuilt the platform first, upgrading the server from outdated software, restructuring the URLs and optimising images. The homepage became about 60% lighter and its performance score went from 44 to 80. I also added custom tracking to a site that previously had none, so the redesign could be measured.
Redesigning the pages
I turned the findings into design decisions with the team, and my design colleague led the visual layout of the new pages.
01
Talk to a Specialist
Added to every hero, beside Request a Quote.
02
Real dimensions first
Pages lead with what the product can make, measured.
03
Carousels unrolled
The 285D printer page’s key strengths are always visible now.
04
Proof moved up
Institution logos below the homepage fold, and redesigned case study pages in a new Discover section.
05
A plain spoken hero
The homepage now says what we make.
06
A clearer printer overview
Request a Quote first, a helper bar and a clearer comparison link.
07
Sample with the materials
The free sample is offered on the resin pages.
07
What worked, and what didn’t
What worked
Before and after the redesign
The nine months after the redesign against the same nine months before it.
BeforeAfter
Engagement time per desktop visitor
38s
45s
18% longer
Engagement time per search visit
45s
52s
16% longer
Share of search visitors who came back
10.7%
17.9%
1.7×
Visits per search visitor
1.33
1.66
25% more
Measure
Before
After
Change
Engagement time per desktop visitor
38 seconds
45 seconds
18% longer
Engagement time per search visit
45 seconds
52 seconds
16% longer
Share of search visitors who came back
10.7%
17.9%
1.7×
Visits per search visitor
1.33
1.66
25% more
The 285D printer page’s strengths, once one slide in a carousel, are now the most engaged section of that page.
People understand the new homepage at a glance. In a 20 second first impression test with screened life science researchers, 77% rated it clear or very clear, and about three in four described it correctly as a 3D printing system for microfluidic devices.
The printer overview became the best routing page we measured. About a third of its visitors move on to another page, helped by the clearer structure.
The URL restructure cost nothing in search, because pages whose URLs moved lost search traffic at the same rate as pages that didn’t.
What didn’t work yet
The free sample
By September 2026, sample requests had reached 73% of 2024’s full year. The offer sits high on one resin page but below where most readers stop on another, and the sample page itself is thin.
Moving between pages
Still about one and a half pages per visit, 92% of visitors never click an internal link, and the navigation draws more clicks than Request a Quote on the 285D printer page.
The homepage
The new hero shipped, but the homepage improved least of any page and its time on page fell over the year.
Comparing products
The comparison table content is unchanged and still makes the cheaper printer look sharper, and resins still can’t be compared side by side.
08
What I learned
What was built worked, and most of what didn’t work was never built.
Every clear success sits on something that shipped, and every clear failure sits on something that hasn’t changed yet, from the quote form to the booking calendar.
Test the team’s beliefs before designing for them.
Writing down what we believed and checking it against the data kept the research from simply confirming our own opinions. Two of the three beliefs turned out to be a different problem than we thought.
Measurement is a design deliverable.
The old site couldn’t tell us whether anything worked. Building tracking into the new one is what made these conclusions possible, and what let me trace a business number back to the experience behind it.